- Eğitim
- Trading Strategies
- Simplified Breakout Trading Strategy
Simplified Breakout Trading Strategy
Have you ever wanted to foresee big market movements before they happen? Learn a simple trading strategy that combines traditional indicators to achieve this. This guide will simplify your trading and expand your potential returns.
- Breakout strategy basics: Learn the core concept.
- Indicator setup: Configure MACD, RSI, and identify key levels.
- Identifying opportunities: Spot entry cues using indicators.
- Trade execution: Determine when and where to enter trades.
Breakout strategy basics
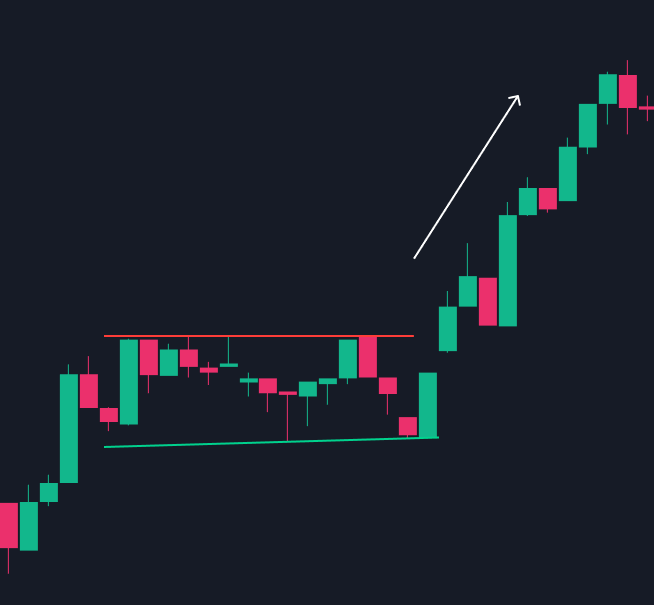
Breakout trading is a dynamic strategy that focuses on identifying significant price movements as an asset breaks through key resistance or support levels. It’s like catching a wave just as it starts to form, giving you a chance to benefit if timed well.
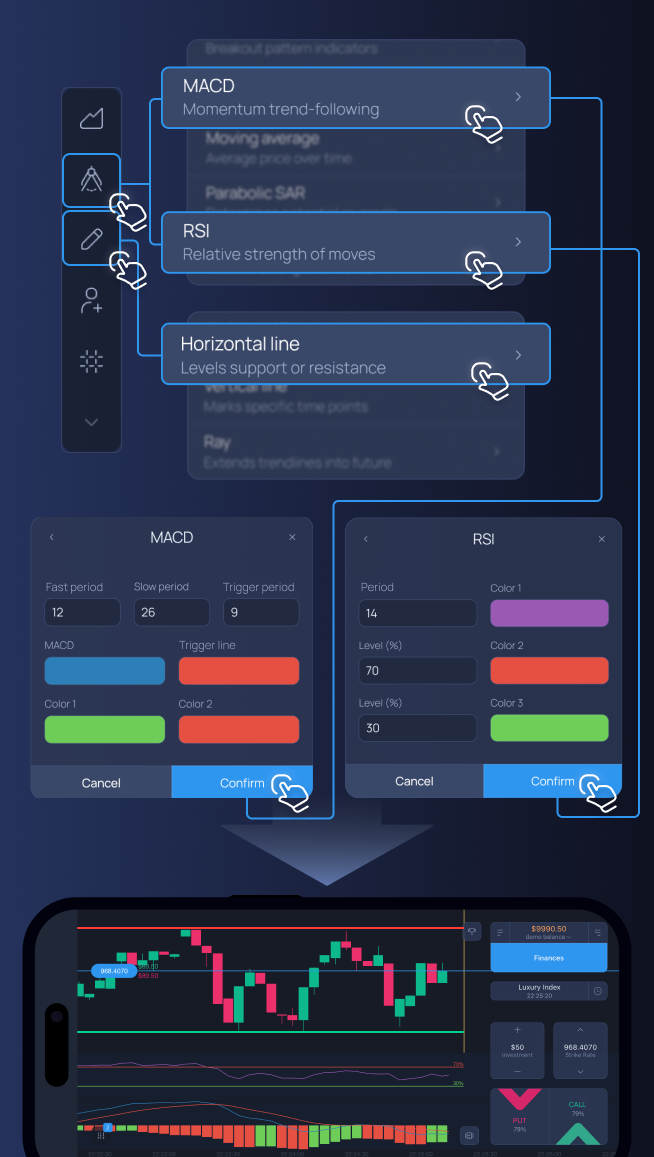
Indicator setup
- MACD (Moving Average Convergence Divergence): Set up with default settings (12, 26, 9). It helps identify momentum and trend direction.
- RSI (Relative Strength Index): Use a 14-period setting to gauge market overbought or oversold conditions.
- Support & Resistance Levels: Identify historical price levels where the price has repeatedly bounced back or broken through.
Trigger identification
- MACD: Look for the MACD line to cross above the trigger line for a bullish opportunity, or below for a bearish one.
- RSI: Values above 70 indicate overbought conditions (potential put opportunity), while below 30 suggest oversold conditions (potential call opportunity).
- Support & Resistance: A breakout occurs when the price moves beyond these levels with significant volume.
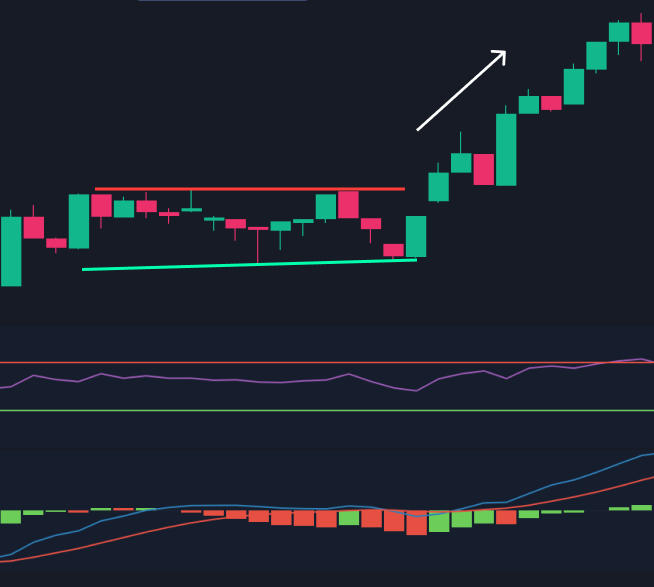
Trade execution
- Bullish Breakout: Place a call trade when the price breaks above resistance, MACD crosses above its trigger line, and RSI is not in the overbought territory.
- Bearish Breakout: Place a put trade when the price breaks below support, MACD crosses below its trigger line, and RSI is not in the oversold area.
Master this breakout strategy with MACD, RSI, and support/resistance levels to enhance your trading decisions. Dive into our platform to practice these techniques in a user-friendly environment and boost your trading confidence. Start your journey towards becoming a more informed and successful trader today!