- Eğitim
- Strategi Perdagangan
- Strategi Dagangan Tweezers
Strategi Dagangan Tweezers
Buka potensi Strategi Tweezers untuk menambah keupayaan dagangan anda! Panduan lanjutan ini memudahkan teknik berkuasa ini, menjelaskan bila dan bagaimana menggunakannya untuk impak maksimum.
- Pelajari Strategi Tweezers: Fahami strategi untuk pembalikan pasaran.
- Kenal pasti formasi Tweezers: Kenal pasti Tweezers atas dan Tweezers bawah.
- Berdagang dengan Tweezers: Tentukan titik masuk dan keluar.
- Tingkatkan strategi: Gabungkan dengan alat analisis lain.
Pelajari Strategi Tweezers
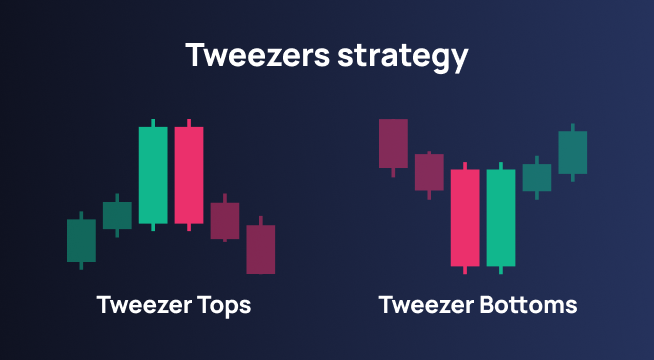
Strategi Tweezers menumpukan pada pengenalpastian dua corak candlestick berturut-turut pada carta di mana harga tinggi dan rendah hampir sama atau identik. Strategi ini menandakan kemungkinan pembalikan arah aliran pasaran.

Kenal pasti formasi Tweezers
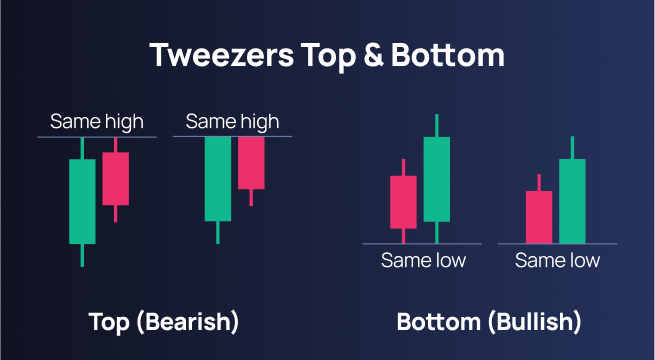
Corak Tweezers boleh muncul di atas (Tweezers atas) atau di bawah (Tweezers bawah) pasaran, menandakan kemungkinan pembalikan bullish atau bearish, masing-masing. Tweezers atas ialah dua candlestick berturut-turut dengan harga tertinggi hampir sama, menandakan potensi pembalikan ke bawah. Tweezers bawah ialah dua candlestick dengan harga terendah hampir sama, menandakan potensi pembalikan ke atas.Formasi ini menjadi petunjuk perubahan sentimen pasaran, membimbing pedagang meramalkan pergerakan masa depan.

Berdagang dengan Tweezers
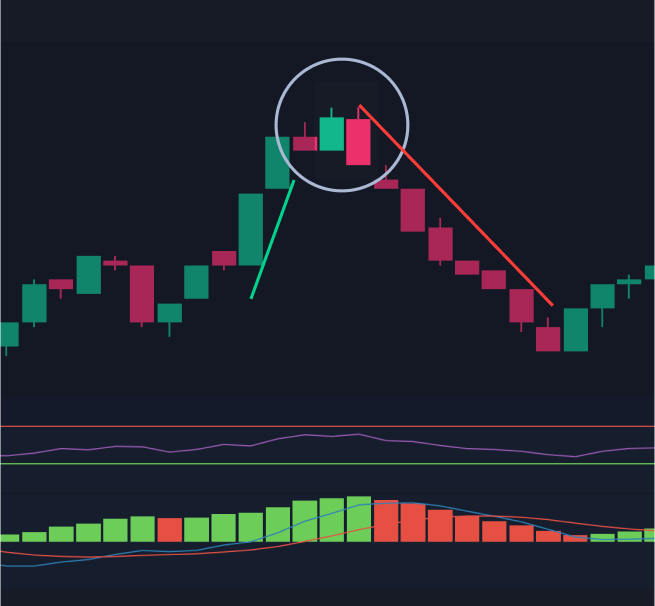
Titik masuk dikenalpasti selepas terbentuknya corak Tweezers. Pedagang akan membuka posisi pendek selepas Tweezers atas dan posisi panjang selepas Tweezers bawah. Titik keluar atau pengambilan keuntungan ditentukan berdasarkan pergerakan harga seterusnya, tahap sokongan dan rintangan, atau nisbah risiko-ganjaran yang telah ditetapkan.
Pelaksanaan dagangan
Isyarat Bullish: Tekan Call apabila corak Tweezers bawah bullish terbentuk di tahap sokongan, menandakan kemungkinan pembalikan ke atas.
Isyarat Bearish: Tekan Put apabila corak Tweezers atas bearish terbentuk di tahap rintangan, menandakan kemungkinan pembalikan ke bawah.
Tingkatkan strategi
Untuk meningkatkan keberkesanan strategi Tweezers, pedagang sering menggunakan alat teknikal tambahan seperti RSI (Indeks Kekuatan Relatif), MACD (Purata Pergerakan Konvergensi Divergensi), dan tahap retracement Fibonacci. Alat-alat ini membantu mengesahkan isyarat pembalikan dan memperhalusi titik masuk serta titik keluar dalam dagangan.

Pelajari Strategi Tweezers untuk mengubah dagangan anda. Dengan isyarat pembalikan yang jelas dan panduan strategik, anda bersedia membuat keputusan yang bijak. Terokai, cuba, dan lihat kemahiran dagangan anda meningkat. Mulakan sekarang dan rasai perbezaannya!